
Your city’s air quality, street by street
CitySatAir is an ESA-funded research initiative project that investigates how satellite data can be better exploited for monitoring and mapping of urban air quality at scales relevant for human exposure.
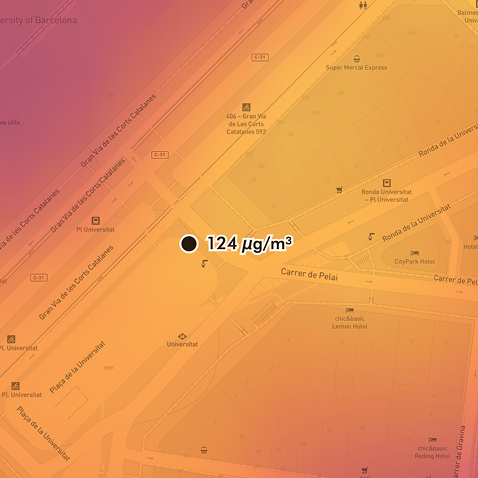
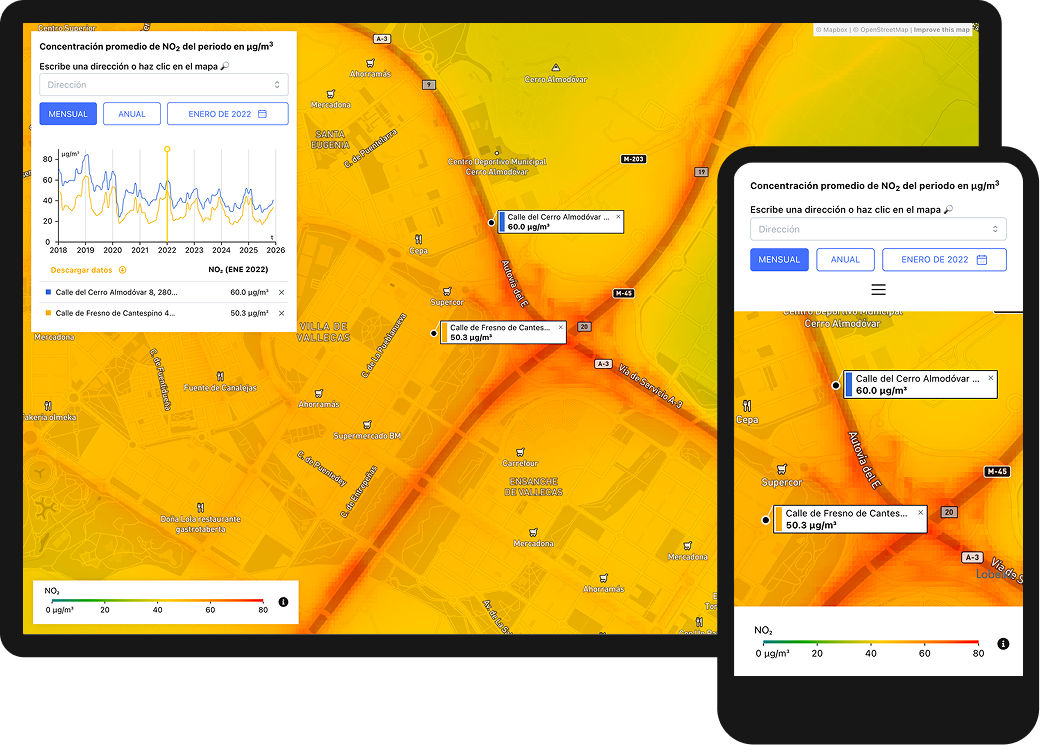
Lobelia.Air is an air-quality monitoring & forecasting tool backed by the CitySatAir. It delivers hourly, high-resolution urban air pollution maps, helping municipalities and communities build cleaner, safer cities and neighborhoods.
Why Lobelia.Air for your city?
According to the WHO, 80% of urban residents breathe air that exceeds recommended safety limits—a figure that rises to 98% in lower-income areas. Yet, understanding air pollution at the local scale remains a major challenge. Across Europe, 83.7% of cities with more than 50,000 inhabitants have one or no reference air-quality monitoring station (EEA), limiting their ability to capture how pollution varies across neighborhoods.
This challenge has become even more pressing with the adoption of the revised EU Ambient Air Quality Directives, which introduces stricter pollutant limits, expands monitoring requirements, and requires Member States to improve air-quality assessment and planning. To meet these new requirements, cities need more complete and reliable information on air quality, even where monitoring infrastructure is limited.
Lobelia.Air addresses air-quality monitoring limitations
Developed under the ESA-funded CitySatAir initiative, the service uses the open-source Retina algorithm to generate street-level air-quality maps by combining data from multiple existing sources, including satellite observations, official monitoring stations, and low-cost sensor networks.
Rather than relying on dense networks of reference stations, Retina integrates these complementary data sources, accounting for the different accuracy and spatial coverage of each one to estimate air quality where official measurements are unavailable.
The resulting maps represent modeled estimates rather than physical measurements, providing cities with a reliable, high-resolution picture of urban air quality while making the most of existing monitoring infrastructure.
Key features of Lobelia.Air
Real time updates
Street-level precision for NOx and PM10.
Up to 72-hour forecast
Plan ahead to mitigate future pollution events.
Alert on pollution episodes
Get alerts when surpassing the pollution concentrations recommended by the OMS.
Retrospective Trends
Analyse pollution history and measure impact.
Pollutant concentrations for selected areas
Optionally, view the average concentrations calculated automatically for selected areas or specific locations on the map.
Healthy routes feature
An optional add-on that calculates and compares walking or cycling routes based on speed versus lowest pollution exposure, helping citizens avoid high-traffic or poorly ventilated areas.
Who is using our maps?






Interested in Lobelia.Air for your city?
Please don't hesitate to contact us for further information or if you have any questions.